Batch Import Performance with Grails and MySQL
I’ve spent some time over the last couple of weeks working on a Grails service that allows us to import new records into our MySQL database.
A number of interesting techniques have popped out of this that I think would be useful for others doing similar types of importing using GORM/Hibernate/MySQL.
Background
For background, the imports in our app happen a few times a week, and range in size from less than a hundred up to a few hundred thousand new records.
It is also possible for us to get updates on previous data that we’ve imported, if a record in the import matches a record in our database, we want to update the existing record rather than inserting a duplicate.
We had a desire to use a Grails service to do the importing as we could leverage our existing data model, plus, there are some special cases where the import logic can get a bit hairy and having access to all of our domain methods is nice.
If you’re doing much more frequent imports, with heavy performance requirements using millions to hundreds of millions of rows, you’ll likely want to look at another tool more specifically targeted for batch/ETL processes or writing something directly in Java. For smaller jobs, you might be surprised how far you can get with groovy and grails.
Example Naive Import Application
To demonstrate the techniques, I’ve created a small test application. This simple app only has Books. It imports 100,000 randomly generated books in a single job (importing a Library of Books). If our database already has a book with that ISBN and edition number, we want to update the title of previous book rather than creating a new book.
Here are the setup files that won’t change as we tweak our application.
The Domain class:
// domain/Book.groovy
class Book {
    String title
    String isbn
    Integer edition
}
The BookController that calls the service:
// controller/BookController.groovy
class BookController {

    def bookService

    def index = {
        def library = new Library()
        def startTime = System.currentTimeMillis()
        bookService.importBooksInLibrary(library)
        render "time: ${(startTime - System.currentTimeMillis())/1000} seconds"
    }
}
And a Library class that’s the source of our books (don’t worry too much about the details of the Library class, just know that it’s the source of the fields that we’ll be importing. For each book, it simply returns a map of the field values that should be saved or updated for the Book):
class Library implements Iterator {
    def startTime = System.currentTimeMillis()
    def lastBatchStarted = startTime
    def BOOKS_IN_LIBRARY = 100000
    def currentBook = 1
    def random = new Random(12345) // random generator with defined seed

    Iterator iterator() { return this as Iterator }
    boolean hasNext() { currentBook <= BOOKS_IN_LIBRARY }
    void remove() { }
    def next() {
        if (! (currentBook % 100) ) printStatus()

        return [
            title: "Book ${currentBook++}",
            isbn: randomIsbn(),
            edition: randomEdition()
        ]
    }

    def randomIsbn() {
        // one of 50,000 random isbn numbers
        return "isbn-${random.nextInt(50000)}"
    }

    def randomEdition() {
        // first through tenth editions
        return random.nextInt(9) + 1
    }

    def printStatus() {
        def batchEnded = System.currentTimeMillis()
        def seconds = (batchEnded-lastBatchStarted)/1000
        def total = (batchEnded-startTime)/1000
        println "Library Book $currentBook, last batch: ${seconds}s, total: ${total}s"
        lastBatchStarted = batchEnded
    }
}
The Library class is a proxy for whatever the source of your import info is (a .csv/excel file that you’re parsing through, a webservice, something posted to your server, etc.).
Also, to help see how we affect timing, every 100 books the Library prints out how long it took to process the last 100 books.
Here is the naive BookService that iterates through the Library that the BookController gives it. For each book it receives a map of the books values. It does a findByIsbnAndEdition() to see if the book already exists. If it does, it updates it, otherwise it will create a new book:
class BookService {
    def importBooksInLibrary(library) {
        library.each { Map bookValueMap ->
            updateOrInsertBook(bookValueMap)
        }
    }

    def updateOrInsertBook(Map bookValueMap) {
        def title = bookValueMap.title
        def isbn = bookValueMap.isbn
        def edition = bookValueMap.edition
        def existingBook = Book.findByIsbnAndEdition(isbn, edition)

        if (existingBook) { // just update title
            existingBook.title = title
            existingBook.save()
        } else {
            new Book(bookValueMap).save()
        }
    }
}
When you run this code, the first thing you notice is how slow it is. The first 1000 records aren’t that bad. On my old laptop they take about 7 seconds to insert. After that things get slower and slower, books 10,000 to 11,000 take 20 seconds to insert. Importing gets progressively worse as time goes on.
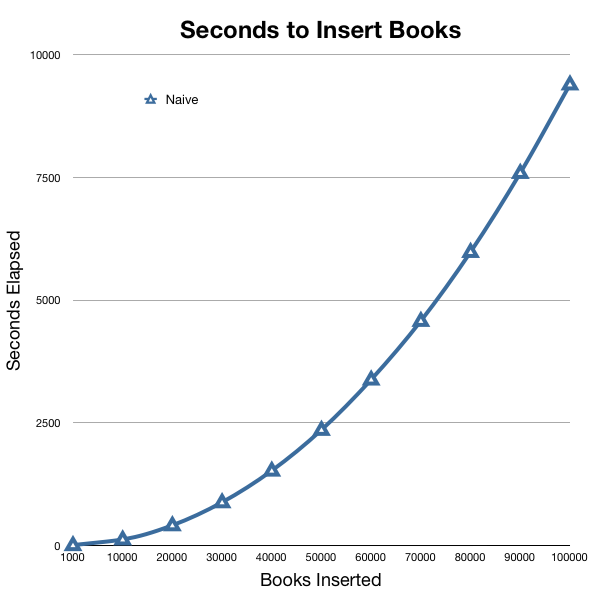
Yikes! It takes 2 hours and 36 minutes to import 100k records? Over 3 minutes for the last thousand books to get imported? That can’t be right.
As it runs, if you open up your activity monitor/task manager/top application, you’ll also see that Grails is running very hot but also that MySQL’s CPU usage is slowly going up over time.
MySQL Database Performance Tweaks
Start with the obvious: Database Indexes
If you’ve done much database work, you know how much indexes can improve the speed of a query. But how do you know what queries need indexes?
In some situations, like our example above, it can be fairly obvious. We’re calling Book.findByIsbnAndEdition(). Chances are we need an index on the “book” table that includes the “isbn” and “edition” fields:
CREATE INDEX `idx_book_isbn_edition` ON `book`(`isbn`, `edition`);
What if it isn't so obvious which queries need an index?
There are a number of techniques available to us through grails to see what kind of SQL is getting executed.
Turn on grails SQL logging
Within grails, you can turn on SQL logging by putting this in your Config.groovy’s log4j closure:
trace 'org.hibernate.SQL'
Install the p6spy plugin and JDBC SQL profiler
The p6spy grails plugin inserts a proxy between your database driver classes and Grails. Because of this, it knows the full query, including the filled in query parameters and some timing information.
This is useful by itself, but you can have the p6spy plugin log it’s messages to a log4j socket appender that talks to the JDBC SQL Profiler which will aggregate all of the information and help you decide where you’ve got slow queries and need indexes.
Mike Hugo has a great post on using the p6spy plugin with the JDBC SQL profiler.
Turn on the MySQL Slow Query Log
If you’re using a recent version of MySQL, there’s an easy, built-in way to see which queries are slow and which queries aren’t using indexes: the slow query log.
To turn it on, you simply need to add a few lines to your mysql cnf file (by default on OSX just create a file at /etc/my.cnf and it will get loaded):
[mysqld]
log-slow-queries
#Log all queries > long_query_time seconds, default 10 seconds
long_query_time=1
This will automatically create a log file in your mysql “data” directory called host_name-slow.log that contains all queries taking longer than 1 second.
You can optionally add
log-queries-not-using-indexes
And this will also log those queries that don’t have an index (but don’t take longer than 1 second to execute).
MySQL also comes with a perl script to parse through the slow log file and show you the number of times each query is slow with some additional statistics. To run it, you need to add basedir to your my.cnf file. The basedir value just holds the location of mysql’s data directory.
basedir=/usr/local/mysql
Then run the script:
mysqldumpslow
These steps should get you a long way towards figuring out which tables need indexes.
Turn on the MySQL General Query log
MySQL has an additional query log called the general query log. It logs everything that comes into MySQL and is extremely noisy. One benefit of it though is that it gives you the full query with all parameters, so it’s more useful than turning on grails SQL trace log and potentially a little quicker to set up than the p6spy plugin.
You can enable it by putting this in your my.cnf:
general_log=1
Suggested Reading for MySQL indexes
If you haven’t created many indexes before, I highly suggest reading this post on indexes on the mysql high performance blog. The executive summary is that multi-key indexes tailored to your query have a performance edge over individual key indexes on each of the fields. If you’re executing a query enough times, it might be worth creating a multi-key index like we have above.
MySQL Database Engines
If MySQL is still your performance bottleneck, or if you’re finding that everything else comes to a stop when you’re running your batch import, check which storage engine you’re using.
For grails applications, I’d prefer InnoDB (or Falcon) to the default MyISAM. MyISAM is good for read-only situations where you don’t care about enforced foreign key releationships. Switching to InnoDB has significantly increased the performance of my app in a number of situations. InnoDB also supports row level locking, whereas MyISAM will lock the entire table when doing an update or an insert.
If you haven’t explicitly done anything, chances are that all of your grails-generated tables are MyISAM. You can change the default storage engine for mysql by specifying a different engine in your my.cnf:
default-storage-engine=innodb
To see the default is for your database execute:
show engines;
To see the engine for a particular table, use “show create table”:
mysql> show create table book\G
*************************** 1. row ***************************
       Table: book
Create Table: CREATE TABLE `book` (
  `id` bigint(20) NOT NULL AUTO_INCREMENT,
  `version` bigint(20) NOT NULL,
  `edition` int(11) NOT NULL,
  `isbn` varchar(255) NOT NULL,
  `title` varchar(255) NOT NULL,
  PRIMARY KEY (`id`)
) ENGINE=MyISAM AUTO_INCREMENT=84192 DEFAULT CHARSET=latin1
1 row in set (0.00 sec)
If you need to alter the storage engine for an existing table, you can execute the alter table SQL statement:
ALTER TABLE book ENGINE = INNODB;
Grails Performance Tweaks
Adding an index and modifying the storage engine of our example book table to InnoDB make our sample app 25-30% faster. A nice boost from where we were originally, but things are still way too slow:
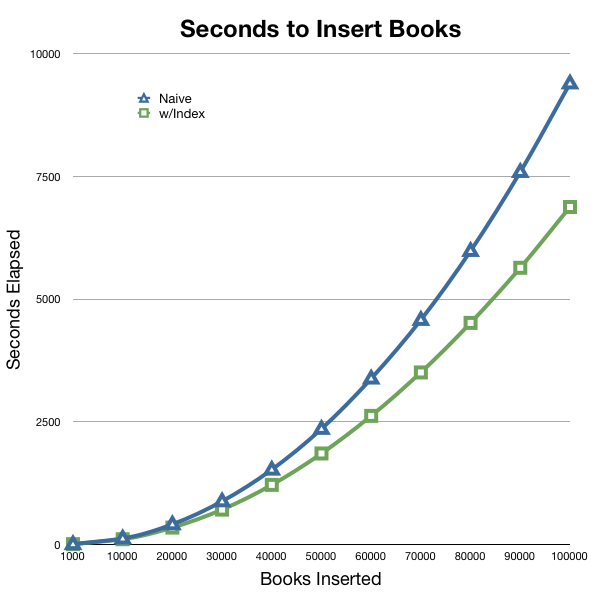
Adding indexes to the database drops the database CPU utilization to almost nothing, but grails is still pegged and it still gets much slower over time.
Something is amiss.
At this point, some people might be inclined to believe the myth that “grails is slow” and go through a painful rewrite in another “faster” language/technology.
Don’t go there yet! It’s only slow if you don’t understand what’s actually going on under the covers.
After reading through a couple of very helpful posts by Burt Beckwith, and reading through the Hibernate chapter on batch processing, we have all of the information we need to speed things up significantly.
Use a Monitoring Tool to Watch Memory/CPU usage Over Time
Because the import gets significantly slower over time, even with the index applied, we know there is some sort of leak.
If you don’t have your code instrumented with timing logic already in it, it’s easy to pop open jconsole or jvisualvm (both already installed and likely in your classpath if you have Java 1.6), connect to your grails instance and watch performance/cpu utilization over time.
The Culprits: Hibernate First-Level Cache and Grails Validation Cache
I found on Burt Beckwith’s blog, that there are 2 separate leaks, one of them is in the hibernate first-level cache, the other is a map that Grails uses for domain object validation errors.
Normally, a grails hibernate session executes something quickly and returns. During importing, we do a ton of processing, all with the same hibernate session. All of these objects that would normally be garbage collected when the session closed are piling up.
The easiest way to deal with this is to create a simple method to clear out these collections periodically.
We can modify our BookService to clean up GORM after every 100 books we insert:
class BookService {

    def sessionFactory
    def propertyInstanceMap = org.codehaus.groovy.grails.plugins.DomainClassGrailsPlugin.PROPERTY_INSTANCE_MAP

    def importBooksInLibrary(library) {
        library.eachWithIndex { Map bookValueMap, index ->
            updateOrInsertBook(bookValueMap)
            if (index % 100 == 0) cleanUpGorm()
        }
    }

    def cleanUpGorm() {
        def session = sessionFactory.currentSession
        session.flush()
        session.clear()
        propertyInstanceMap.get().clear()
    }

    def updateOrInsertBook(Map bookValueMap) {
        // ... same as above
    }
}
This change makes everything much better. All 100,000 books get inserted in 3 minutes, the same time that it took the naive example to insert the last 1,000 books.
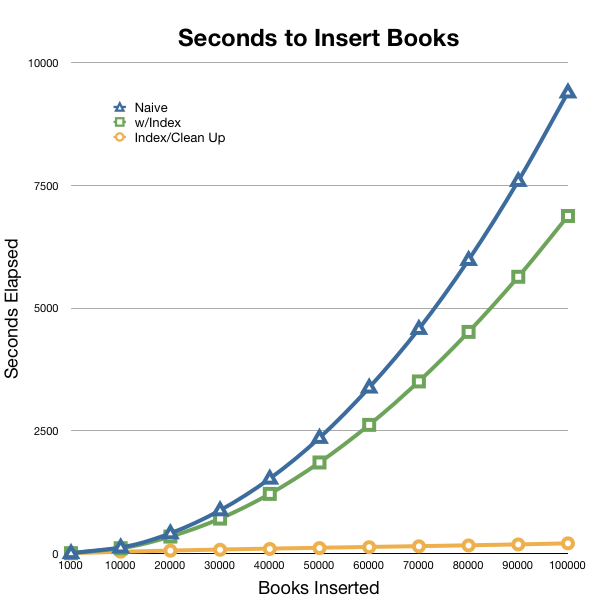
Also, because MySQL is now properly using indexes, the load on it is very light. If we’re looking for even more speed improvement, this would allow us to split our work up into batches and to make multiple BookService calls (potentially on different web servers). Because we’ve switched to using InnoDB, we’re now working with row-level locking, which isn’t hostile to this approach unlike MyISAM and it’s full table locking on Insert/Update.
Conclusion
This post is just some of what can be done to improve batch performance with Grails and MySQL. Using these tips, I was able to speed up my own imports to a level that met the speed requirments for our problem space, but kept our code much more maintainable. Our domain object remain the canonical code representation of our database model.
There are a number of other things that could be looked at to further speed up batch performance and that could be important to your particular application/infrastructure.
- connectivity between app server and DB
- giving enough memory to your app and DB servers
- other load into database and app servers
- anemic hardware
- poor database design
Be sure to weigh the cost of making changes in each of these areas, and run benchmark tests before committing to them. You’ll often find that what you think is the bottleneck, isn’t. Speed is a feature, but you need to balance it with the costs to achieve it.